In January 2026, Bitcoin plunged from $102,000 to the $86,000 range in just three weeks, recording losses of over 15%. This decline goes beyond a mere 'correction'—it's a convergence of multiple bearish factors: massive ETF outflows, mining ecosystem collapse, failure to hold the 365-day moving average, and extreme weather events. This isn't just a price adjustment; it's a signal that the market structure itself is changing. In this article, we provide an in-depth analysis of five critical bearish signals currently surrounding the Bitcoin market, backed by data, along with essential survival strategies for investors.
Executive Summary
The current Bitcoin market faces a dangerous situation where 'seller exhaustion' coexists with 'buyer absence.' Over $1.1 billion has flowed out of ETFs for 5 consecutive days, mining hashrate has crashed 30-40%, and if the $86,000 support fails, further decline becomes inevitable.
1. The ETF Outflow Trap: Institutional Investors Are Leaving 💸
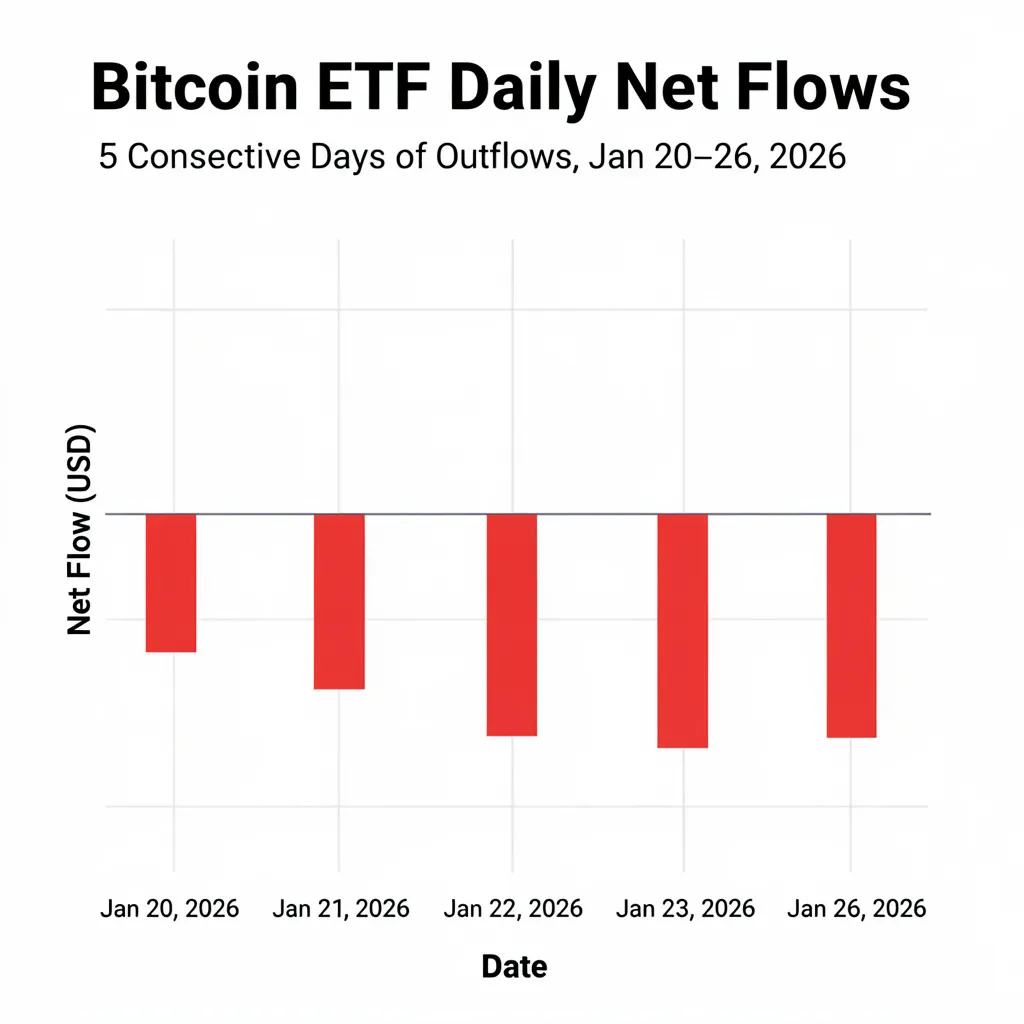
Since the SEC approved spot Bitcoin ETFs in January 2024, Bitcoin entered the 'era of institutions.' However, exactly two years later in January 2026, those institutions have begun to leave. From January 20 to 26, U.S.-listed spot Bitcoin ETFs saw a total net outflow of $1.137 billion (approximately $113.7 million per day) over five consecutive trading days—the largest weekly outflow since November 2025.
The most shocking aspect is that the outflows weren't isolated to specific issuers. BlackRock's IBIT, the market leader, alone saw $508 million leave, while Grayscale's GBTC lost $290 million and Bitwise's BITB saw $150 million in outflows. The fact that all major issuers experienced simultaneous capital flight signals strategic risk reduction rather than simple rebalancing.
CoinShares' Head of Research James Butterfill attributes these outflows to three factors: First, vanishing rate-cut expectations. According to the CME FedWatch Tool, the market is pricing in only a 2.8% probability of rate cuts. As the era of 'zero interest rates and liquidity balloons' deflates, institutions are reducing their allocation to risk assets like crypto.
Second, negative price momentum. Since hitting $125,000 in October 2025, Bitcoin has displayed a pattern of lower highs. Trend-following institutions automatically reduce positions during such downtrends. Third, failure of the 'debasement trade'. Bitcoin has long been positioned as a hedge against currency debasement, but despite growing U.S. fiscal deficits and dollar weakness, Bitcoin has failed to participate, leading some institutions to question whether Bitcoin can truly fulfill its intended role.
Key Point
While ETF outflows briefly turned to inflows on one trading day ($6.84 million), this is negligible compared to the $1.1 billion outflow. Institutions require clear macro catalysts and a reclaim of the $90,000 support before returning.
2. Technical Deadlock: 365-Day MA Breach and Resistance Walls 📉
From a technical analysis perspective, Bitcoin is in a precarious position in January 2026. Particularly concerning is the drop below the 365-day moving average (approximately $101,000). This MA acted as resistance during the 2022 Crypto Winter, suppressing rallies. The fact that price remains below this line suggests the long-term uptrend may be broken.
Additionally, the Ichimoku Cloud on the weekly chart is beginning to twist. Weekly cloud twists are typically interpreted as trend reversal signals. Currently, Bitcoin sits below the Ichimoku cloud, suggesting the medium-term downtrend may continue.
| Technical Indicator | Current Level | Signal | Implication |
|---|---|---|---|
| 365-Day Moving Average | $101,000 | Below | Long-term trend reversal risk |
| Ichimoku Cloud (Weekly) | Below cloud | Bearish | Medium-term downtrend continuation |
| Bollinger Bands | Lower $84,000 | Squeeze | Violent volatility expansion expected |
| RSI (14) | 42 | Neutral ↓ | Room for further decline exists |
| Support Level | $86,000-$87,600 | Defending | Breakdown opens path to $80k |
Currently, Bitcoin is desperately defending the $86,000-$87,600 zone, but facing strong resistance at $90,000-$95,000. This zone represents approximately 30% drawdown from the October 2025 highs—a level where many investors who bought above $110,000 are looking to exit at breakeven.
According to CryptoQuant data, Realized Loss is concentrated among 3-6 month and 6-12 month holder cohorts. These are investors who bought above $110,000 and are now sitting on losses. When prices attempt to recover, they sell, creating overhead supply. Until this structural selling pressure subsides, Bitcoin will struggle to break above $90,000.
"January's rally was driven by short-term positioning, not fundamental repricing. The $91,000 breakout was a product of geopolitical catalysts and short covering—without sustained spot demand, it can easily fizzle out." — Crypto Raven, Market Analyst
3. Mining Ecosystem Pain: Winter Storm Fern and Hashrate Crash ⛈️
In late January 2026, Winter Storm Fern struck Texas and surrounding areas, delivering a fatal blow to the Bitcoin mining industry. Extreme cold and power outages forced mining operations to shut down en masse, causing Bitcoin's SHA-256 hashrate to plummet from 1.1-1.13 ZH/s to 663 EH/s—a 30-40% drop and a 7-month low.
Particularly hard hit was Foundry USA, the largest U.S. mining pool, which saw hashrate drop from 340 EH/s to 124-198 EH/s—a 60% crash. Luxor also fell from 40 EH/s to 16 EH/s. This hashrate collapse reveals the vulnerability of the mining industry beyond mere technical issues.
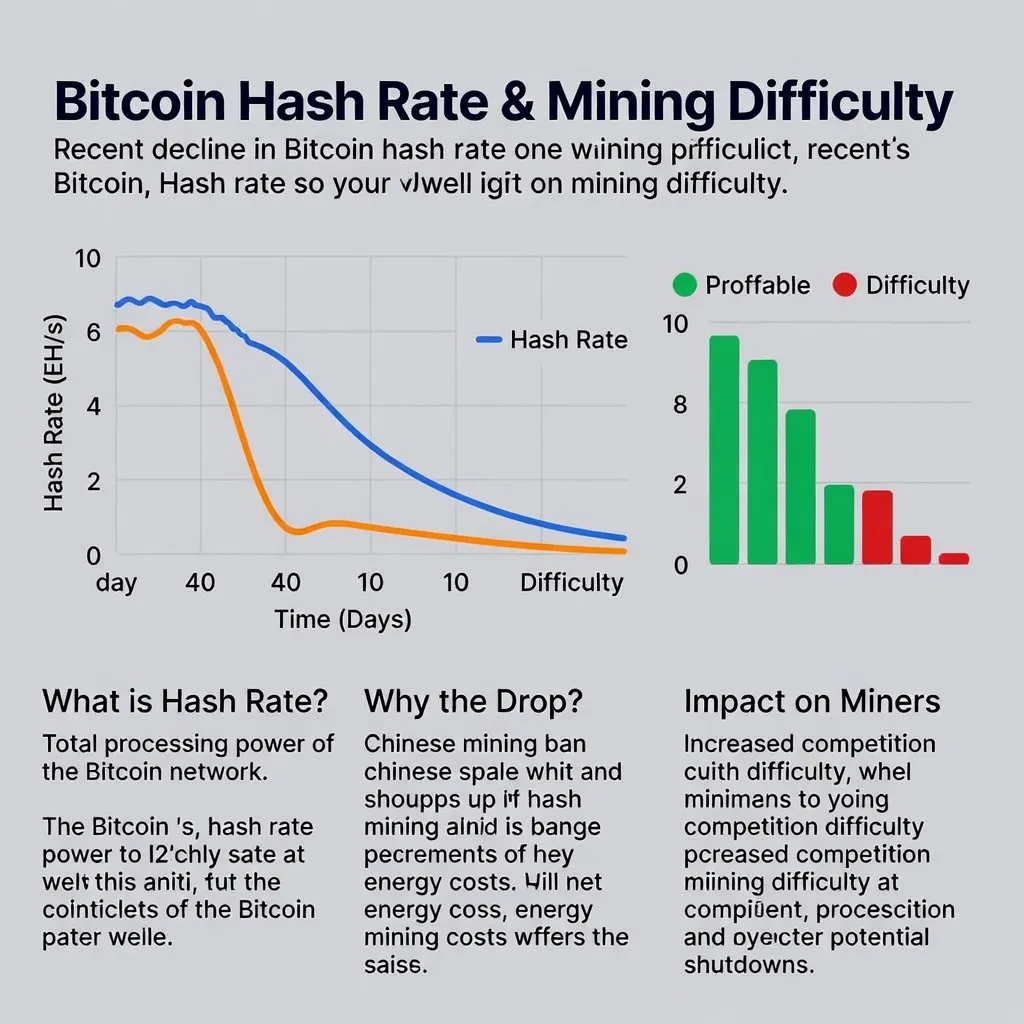
Mining difficulty had been rising continuously since the April 2024 halving, hitting an all-time high of 155.9 trillion in November 2025. However, it has since dropped to 146.4 trillion, with the next adjustment on February 8 expected to fall by -16% to -18%. This reflects the severe profitability deterioration miners have faced post-halving, with 2025 being recorded as "the worst margin environment in mining history."
Miners' Hashprice—daily revenue per petahash—has fallen below $35, breaching the breakeven point of $40. With many small mining operations going bankrupt or liquidating equipment, miners are forced to sell BTC to cover operating costs, creating additional selling pressure on the market.
Power Grid Risk
The vulnerability of Texas's ERCOT grid has been exposed. Future weather events could force additional mining shutdowns.
Industry Centralization
As weak miners go bankrupt, the industry is restructuring around large players, potentially weakening network decentralization.
BTC Selling Pressure
The decline in BTC holdings by miners creates direct selling pressure. Many mining companies are abandoning 'HODL' strategies.
4. Macro Environment Deterioration: Rate Cut Hopes Fade 🌍
Though called 'digital gold,' Bitcoin's January 2026 price action more closely resembles tech stocks. Geopolitical risks—including Trump administration tariffs on the EU, Venezuela's political instability, and yen defense negotiations between the U.S. and Japan—have strengthened risk-off sentiment.
The QCP Group characterized this as "pressure driven not by crypto-specific issues, but by macro." Particularly concerning is the global liquidity squeeze. The Federal Reserve has kept rates unchanged, with the market pricing in only a 2.8% probability of cuts—a completely different environment from the 'zero rates + liquidity bombs' of 2024-2025.
Additionally, stablecoin supply contraction is a serious problem. In the third week of January 2026 alone, $3.6 billion in USDC was burned, with total stablecoin burn reaching $3.2 billion. This indicates institutions pulling funds from the crypto ecosystem. While USDT saw a +$800 million increase, this is attributed to offshore demand rather than U.S.-based institutional capital.
The Trump administration's fiscal policy is also adding uncertainty. As 'government shutdown' risks increase, both traditional financial markets and crypto markets are experiencing risk-off sentiment expansion. In this macro environment, Bitcoin could drop to the $70,000 range in the short term.
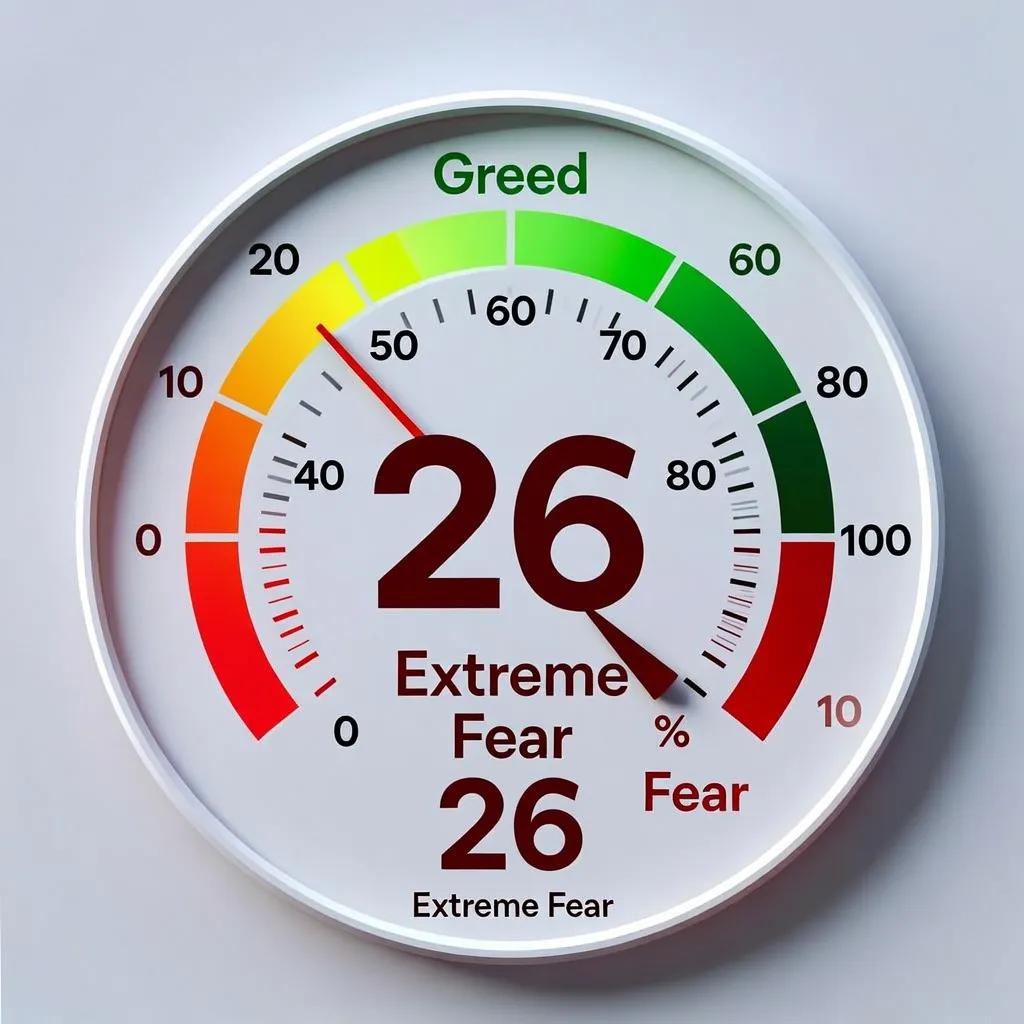
5. Liquidity Crunch and Sentiment: Fear Index at 26 😰
The Crypto Fear & Greed Index currently sits at 26, indicating 'Fear.' Just three months after hitting 'Extreme Greed' (80+) in October, the market has fallen near 'Extreme Fear.' This rapid sentiment shift demonstrates market fragility.
Sentiment analysis from online communities like Reddit shows similar conclusions. Major subreddits r/Bitcoin and r/CryptoCurrency are filled with anxious posts titled "Is the bull run over?" and "Back to 70k?" Particularly notable is panic selling among short-term holders, while even long-term holders are expressing unease that "this time is different."
However, there are also signs of seller exhaustion. According to CryptoQuant, prices remain above the reserve realized price on Binance ($62,000), and the realized loss curve is flattening—suggesting forced selling has largely completed. But the problem is buyer absence. Looking at Spot Taker CVD (Cumulative Volume Delta), buyers enter briefly but quickly return to neutral or selling dominance.
The options market also shows uncertainty. Ahead of January 2026's first monthly expiry (Jan 31), with 25% of total open interest expiring, the market is quiet. Short-term 25-delta skew has collapsed from 15% to 4-5%, suggesting immediate downside hedging demand has decreased, but long-term skew remains at 7-9%—indicating traders' neutral wait-and-see stance regarding long-term uncertainty.
Outlook & Strategy: Survival Manual 🛡️
The current Bitcoin market is in a state of 'defensive neutrality.' There are no catalysts for upside, while downside risks remain. Investors should consider the following strategies:
📊 Scenario Analysis
Bullish Scenario (30% probability)
If ETF outflows stop and $90,000 is reclaimed, breaking $100,000-$102,000 could restart the uptrend. Q1 target: $110,000-$125,000. Requires dovish Fed turn and institutional return.
Bearish Scenario (40% probability)
If $86,000 support breaks, further decline to $80,000-$84,000 is likely. If miners dump BTC en masse, prices could crash to $75,000.
Range-bound Scenario (30% probability)
Prices oscillate between $86,000-$95,000 for 3-6 months, consolidating the bottom. Healthy correction but painful for short-term traders.
⚠️ Risk Management Checklist
- Position Sizing: Never allocate more than 1-3% of total portfolio to a single trade.
- Stop Loss: Consider cutting losses if $84,000 breaks. Avoid leverage below $86,000.
- Leverage: Minimize or avoid leverage during uncertain periods like the present.
- Diversification: Diversify into cash, bonds, gold, and other safe assets, not just Bitcoin.
- Emotion Management: Consider 'generational buying' strategy when Fear Index drops below 10.
In conclusion, the Bitcoin market in January 2026 clearly has "insufficient reasons to rise." A quadruple whammy of ETF outflows, mining ecosystem collapse, technical weakness, and macro headwinds is underway. Investors must now prioritize 'capital preservation' over 'profit maximization.' Exercise patience, maintain cash reserves, and wait for the market to show clear direction.
"The most difficult markets are not those that clearly rise or fall, but those like January 2026 where conflicting signals create uncertainty. Without liquidity and catalysts, any bounce or crash will only be temporary." — Hurst, Amberdata Analyst