
🎯 What is k6?: The New Standard for Modern Load Testing
Launched in 2016 by Swedish startup Load Impact, k6 rose to prominence after being acquired by Grafana Labs in 2021, becoming the leading open-source load testing tool. It introduced a new paradigm of "developer-centric performance testing" that goes beyond being just another tool.

Core Philosophy: Developer-First Approach
What truly differentiates k6 from existing tools is its philosophy of being a "tool for developers." Instead of JMeter's GUI-based complex configurations, k6 lets you write tests in JavaScript—a language developers already know. This brings several benefits:
High-Performance Go Engine
Unlike Java-based JMeter's heavy resource consumption, k6—written in Go—can generate thousands of Virtual Users (VUs) on a single machine while maintaining a lightweight memory footprint.
JavaScript/TypeScript Support
Start immediately with familiar syntax. Easy code reuse and version control through the module system.
CLI-Centric Workflow
A lightweight tool that runs directly from the terminal. Integrates naturally with CI/CD pipelines.
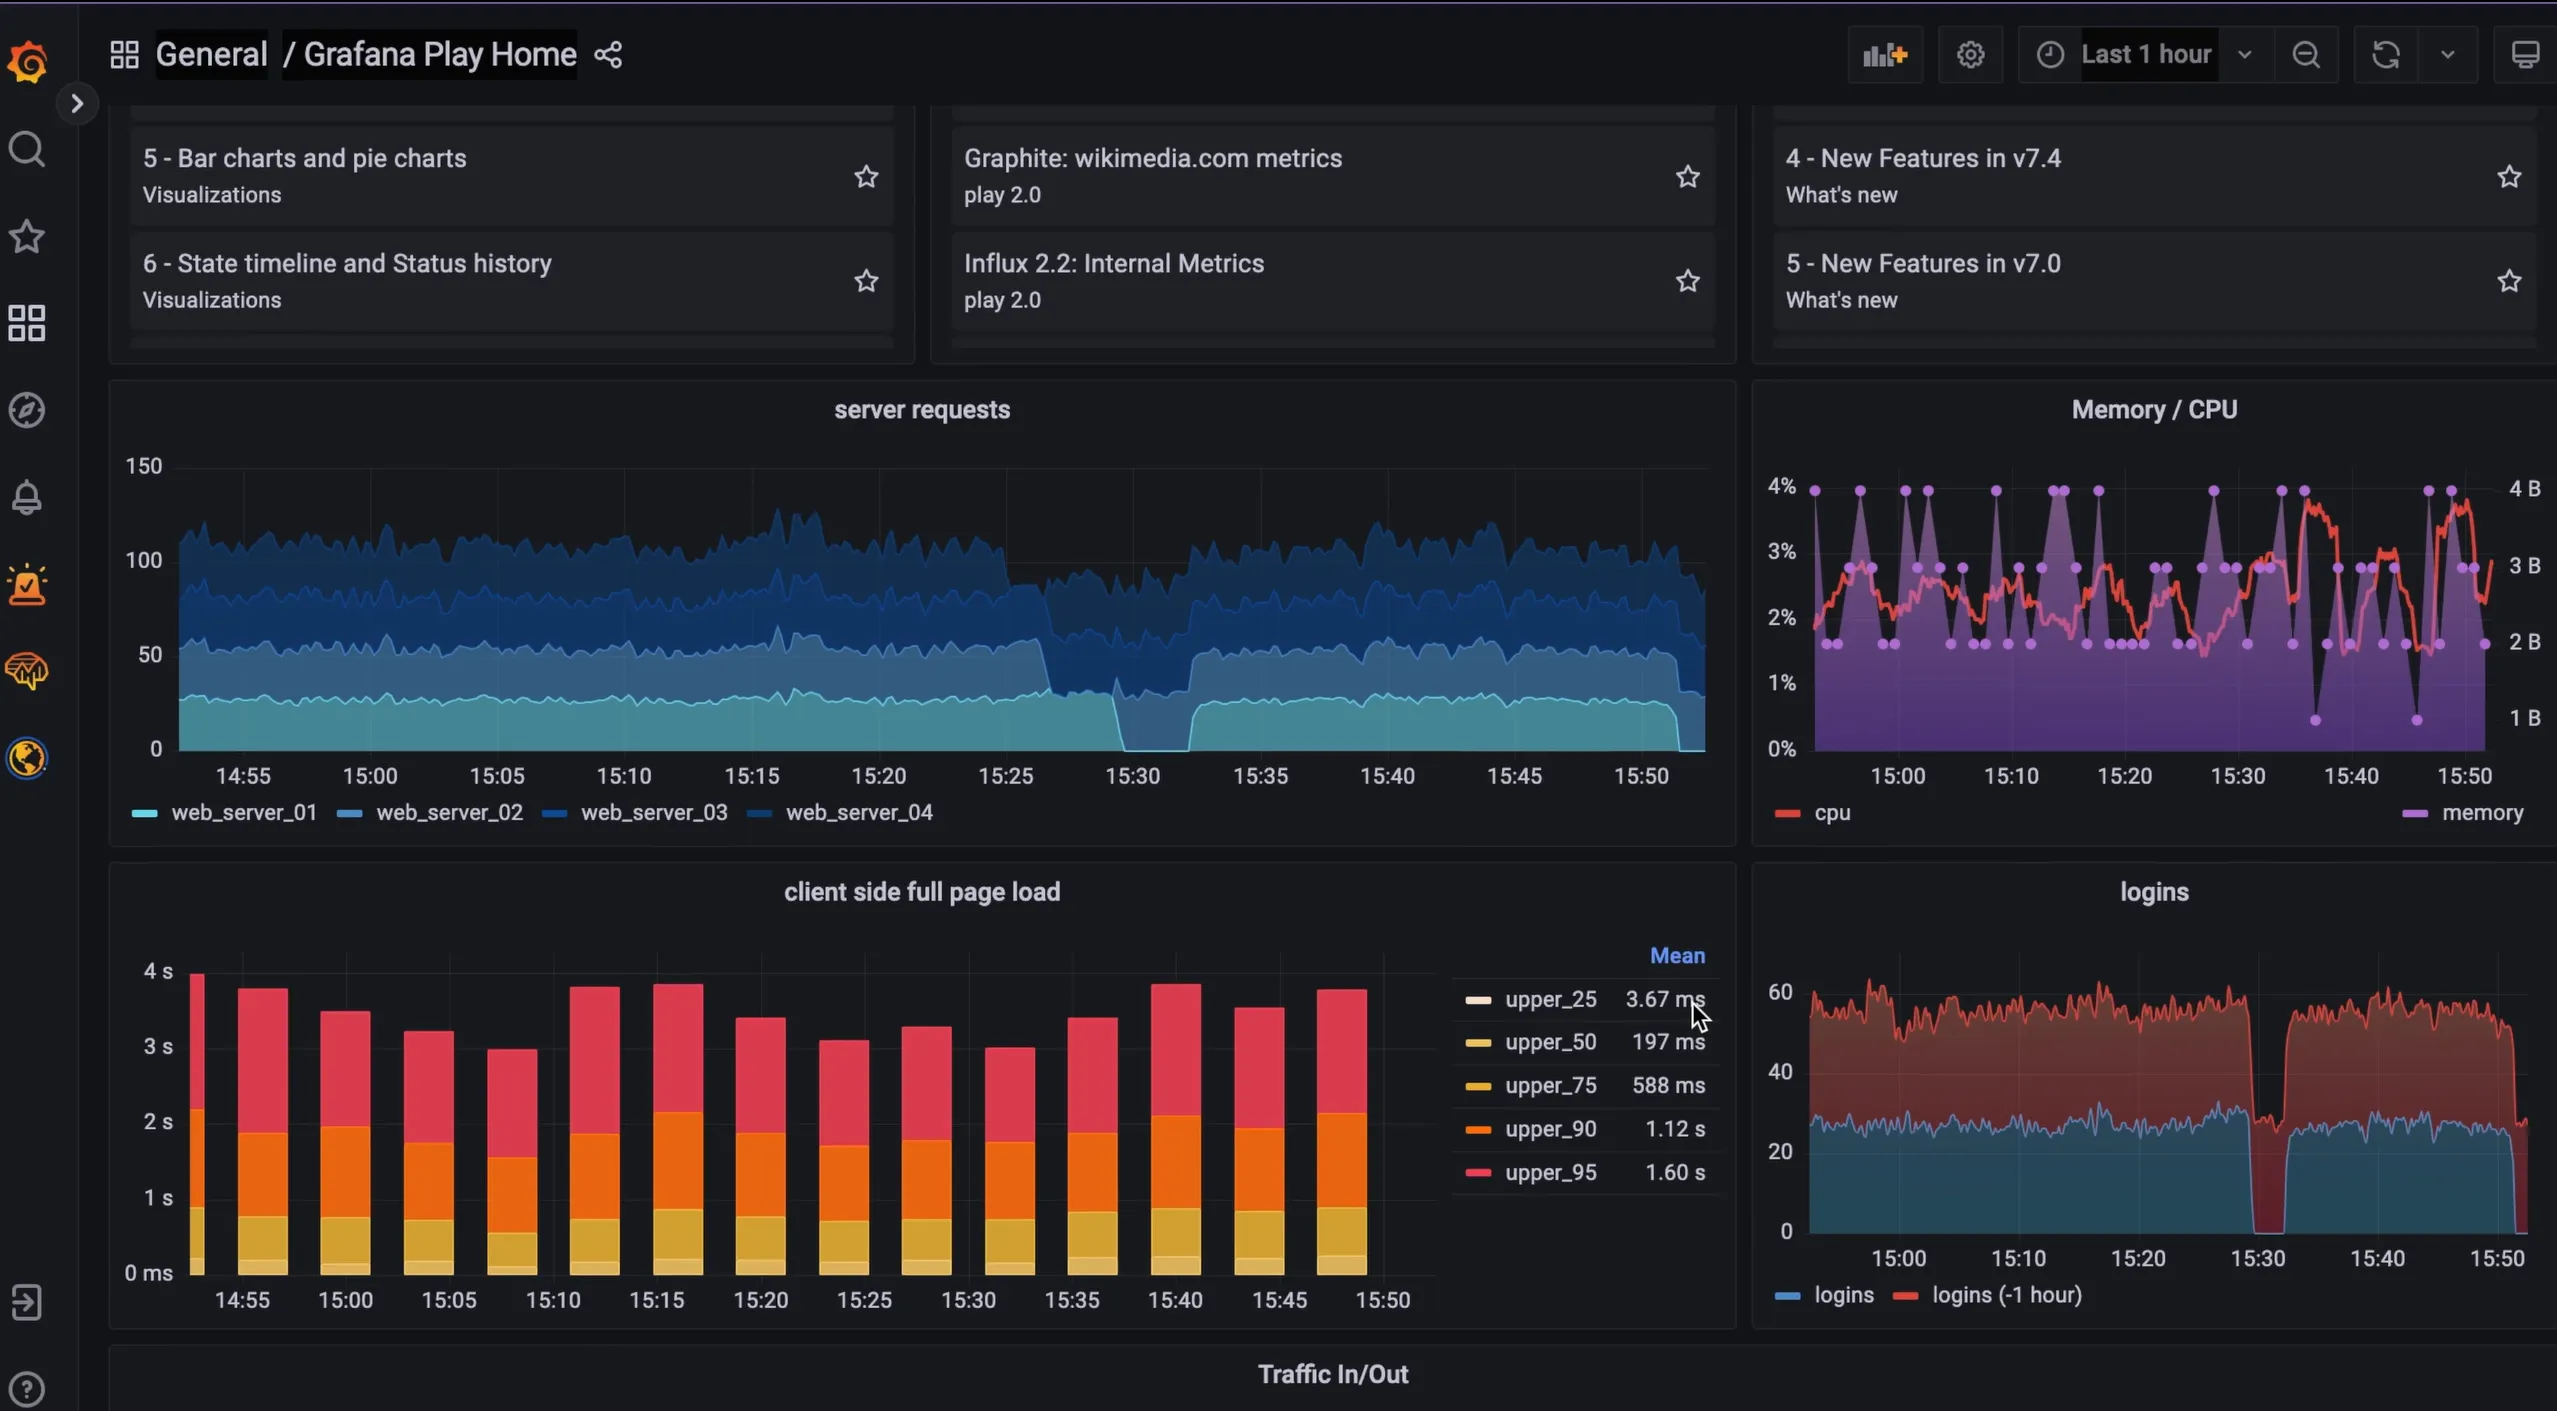
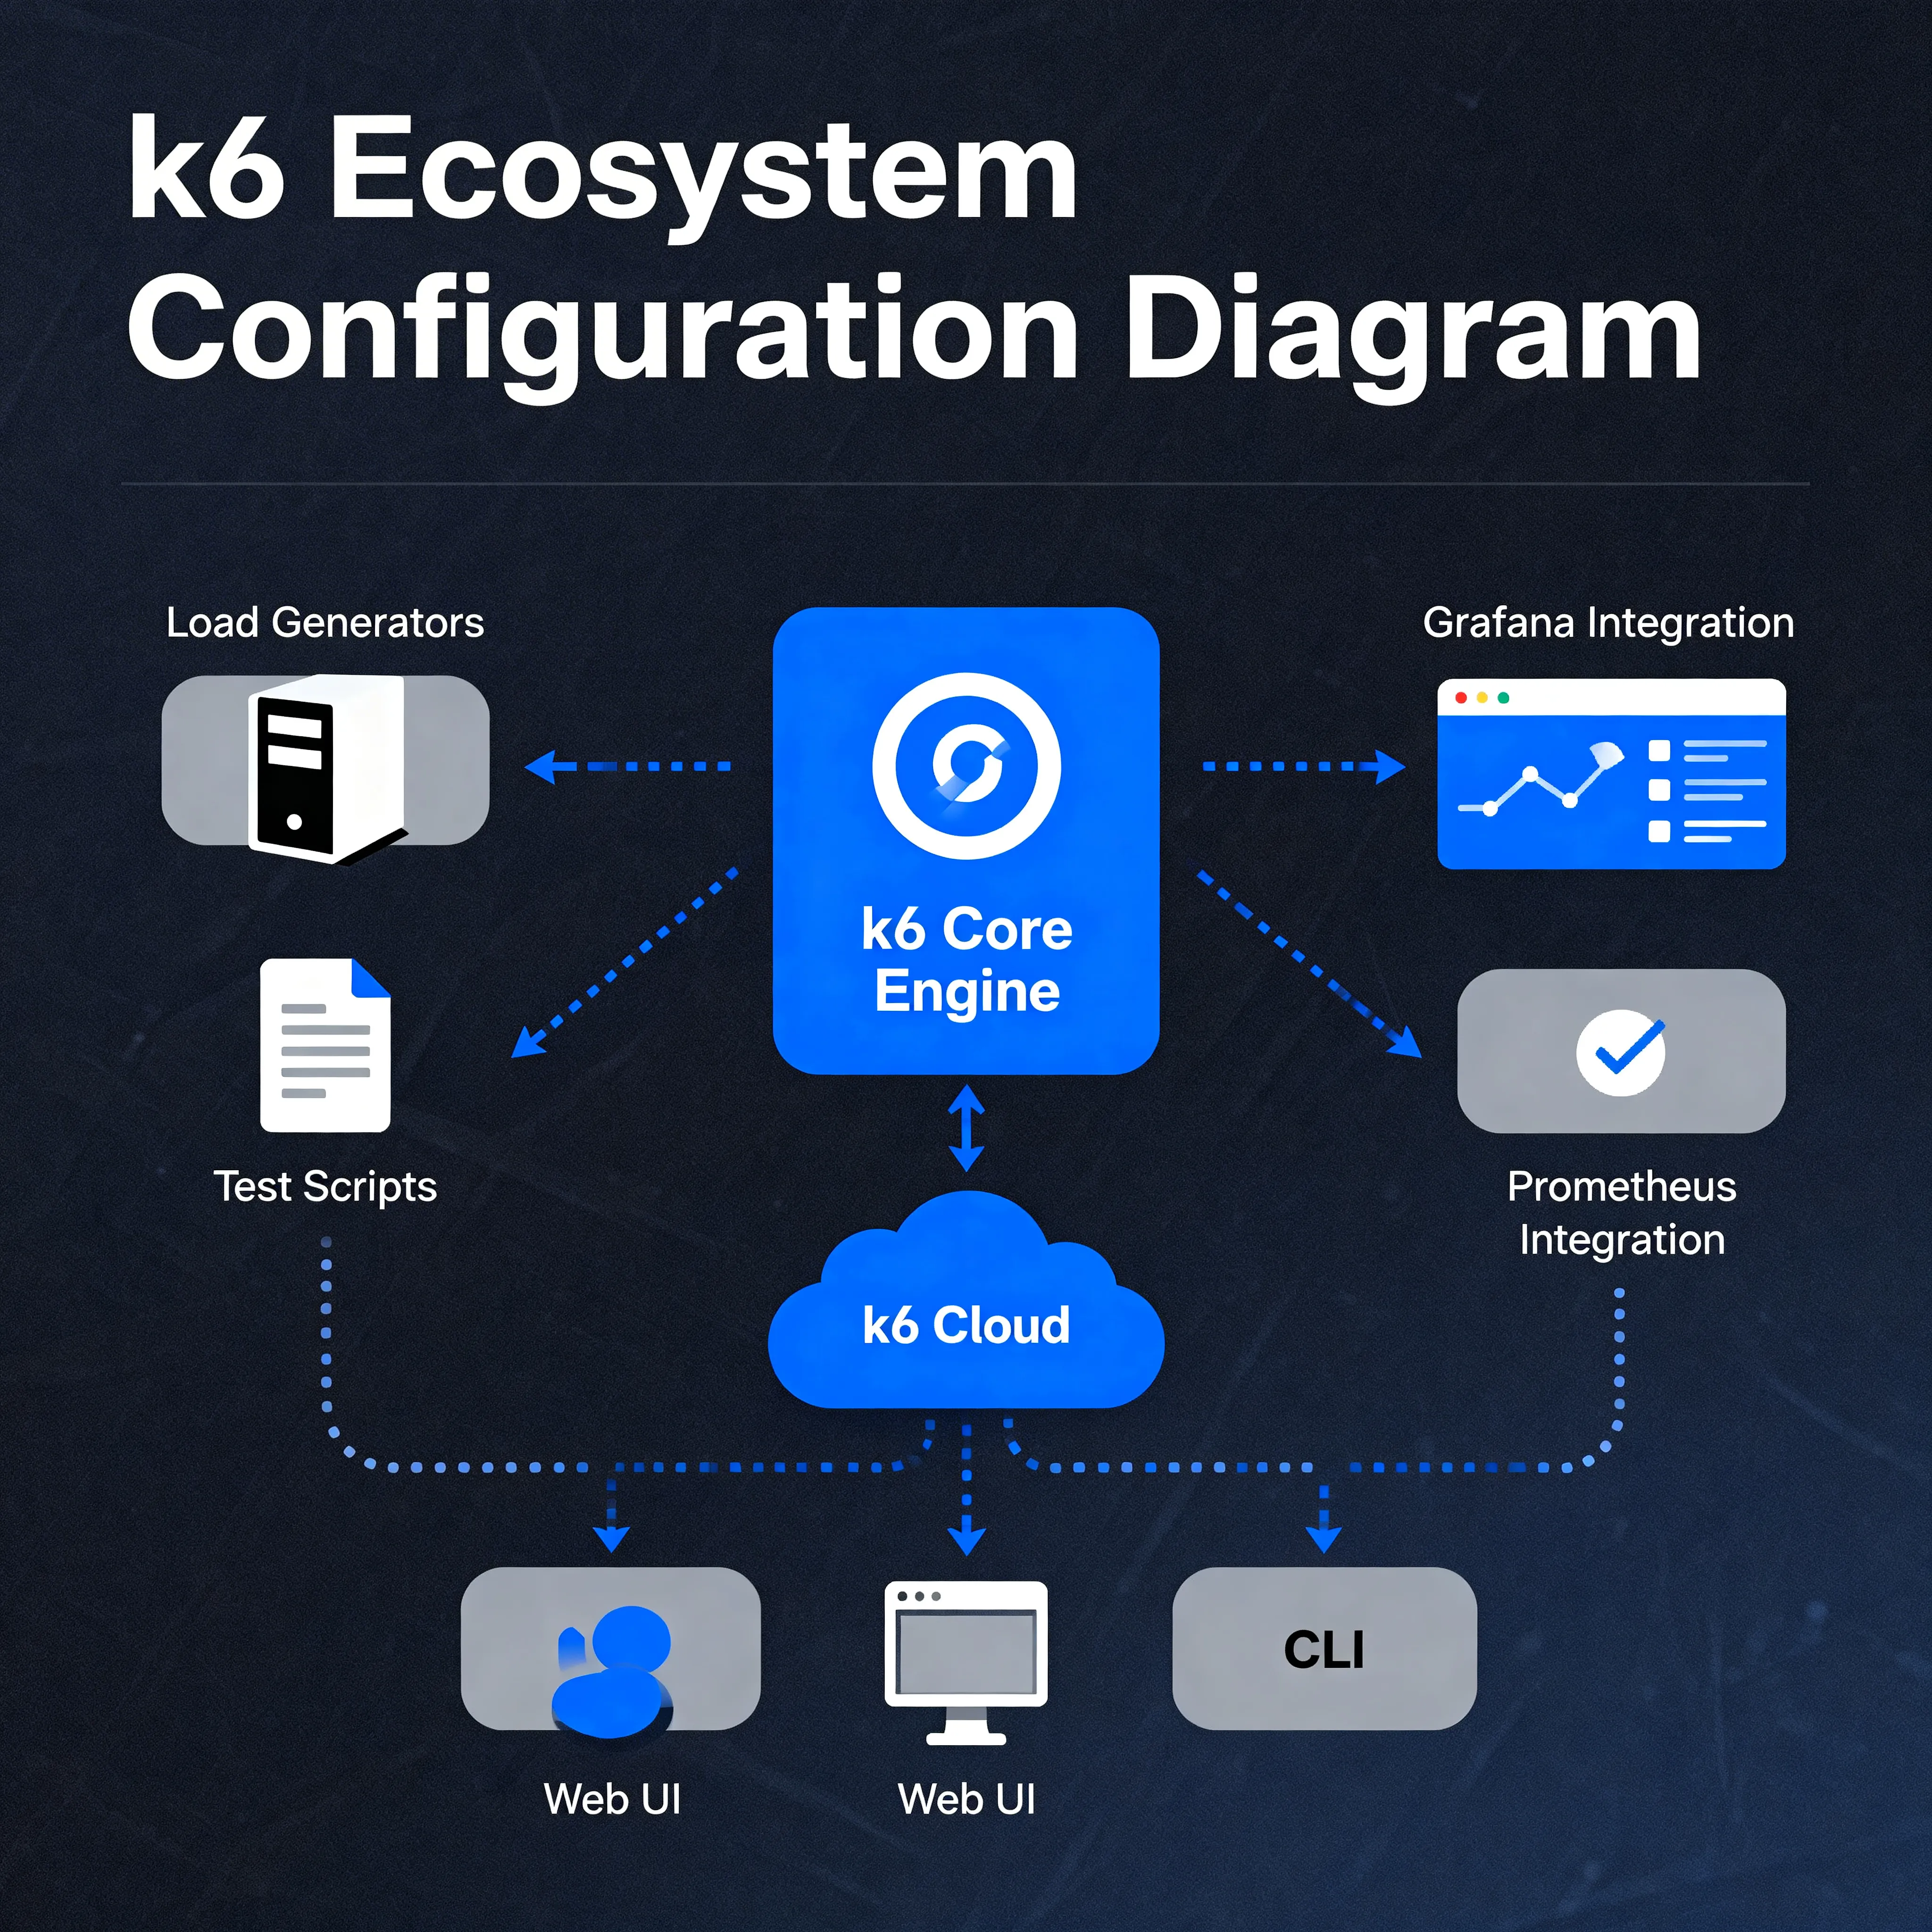
Grafana Native Integration
Real-time visualization of test results with Prometheus, InfluxDB, and Grafana. The perfect bridge between monitoring and testing.
Supported Protocols and Test Types
k6 supports HTTP/HTTPS and WebSocket by default, with extensions covering gRPC, MQTT, and more. Notably, xk6-browser, released in 2023, added browser automation capabilities, enabling both protocol-level and browser-level testing in a single tool.
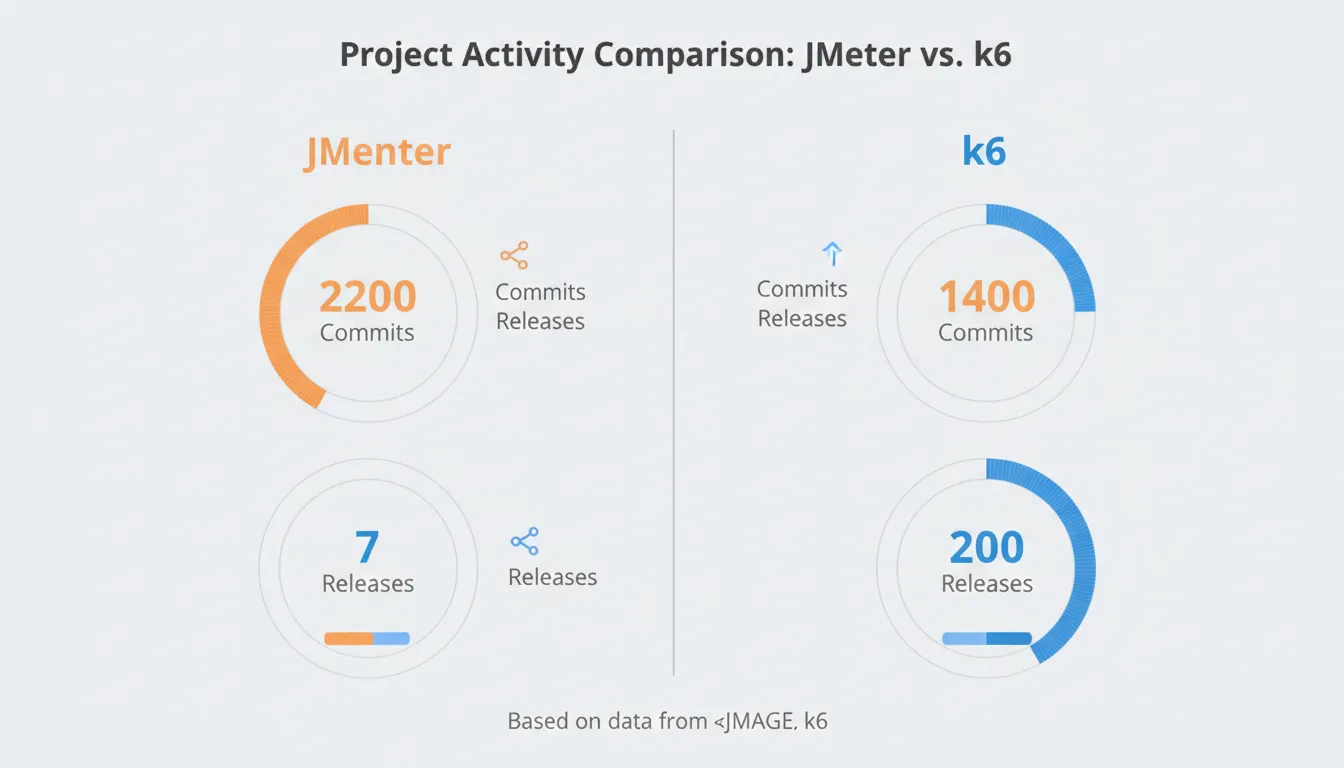
⚔️ Why k6?: Deep Comparison with JMeter
When choosing a performance testing tool, the most common comparison is between Apache JMeter and k6. While JMeter boasts 20+ years of history, extensive protocol support, and a mature ecosystem, k6 has emerged as a better fit for modern development workflows.
Detailed Feature Comparison
| Feature | Apache JMeter | k6 |
|---|---|---|
| Scripting Language | Java/Groovy based | ✅ JavaScript/TypeScript |
| Execution Method | GUI or CLI | ✅ CLI-centric (CI/CD friendly) |
| Resource Efficiency | High memory usage | ✅ Lightweight Go engine |
| Protocol Support | ✅ 20+ protocols (FTP, JDBC, JMS, etc.) | HTTP, WebSocket, gRPC (extensions) |
| Learning Curve | Complex GUI, high barrier | ✅ Code-centric, low barrier |
| Version Control | XML-based (.jmx files) | ✅ Git-friendly JS files |
| Real-time Monitoring | Separate plugins needed | ✅ Grafana native integration |
| Browser Testing | WebDriver plugins | ✅ xk6-browser official support |
| Community/Ecosystem | ✅ 20+ years history, vast resources | Rapidly growing (27K+ GitHub stars) |
Real User Feedback from Reddit Community
"I've been testing with JMeter for 5 years, but after switching to k6, my test writing time dropped by 70%. Just being able to version control with Git was reason enough."
— Reddit r/performanceengineering, Senior QA Engineer
"k6 is simply perfect for microservices environments. Easy to deploy as Docker containers and simple to run distributed on Kubernetes. JMeter container images were too heavy due to JVM dependencies."
— Reddit r/devops, Platform Engineer
🚀 From Installation to First Test: 5-Minute Complete Guide
One of k6's biggest attractions is its ease of installation. You can install it simply through package managers for each operating system, and official Docker images are also provided.
Installation by Operating System
# macOS (Homebrew)
brew install k6

# Windows (Chocolatey)
choco install k6

# Windows (Winget)
winget install k6

# Linux (Debian/Ubuntu)
sudo gpg -k
sudo gpg --no-default-keyring --keyring /usr/share/keyrings/k6-archive-keyring.gpg --keyserver hkp://keyserver.ubuntu.com:80 --recv-keys C5AD17C747E3415A3642D57D77C6C491D6AC1D69
echo "deb [signed-by=/usr/share/keyrings/k6-archive-keyring.gpg] https://dl.k6.io/deb stable main" | sudo tee /etc/apt/sources.list.d/k6.list
sudo apt-get update
sudo apt-get install k6

# Docker
docker pull grafana/k6
Writing Your First Test Script
Once installation is complete, let's write a simple HTTP GET test. Create a file named first-test.js and enter the following code:
import http from 'k6/http';
import { check, sleep } from 'k6';

// Test options configuration
export const options = {
  vus: 10,        // 10 virtual users
  duration: '30s', // Run for 30 seconds
};

// Main test function
export default function () {
  const response = http.get('https://test-api.example.com/users');

  // Response validation
  check(response, {
    'status is 200': (r) => r.status === 200,
    'response time < 500ms': (r) => r.timings.duration < 500,
  });

  sleep(1); // Wait 1 second
}
Now run the test from your terminal with this command:
k6 run first-test.js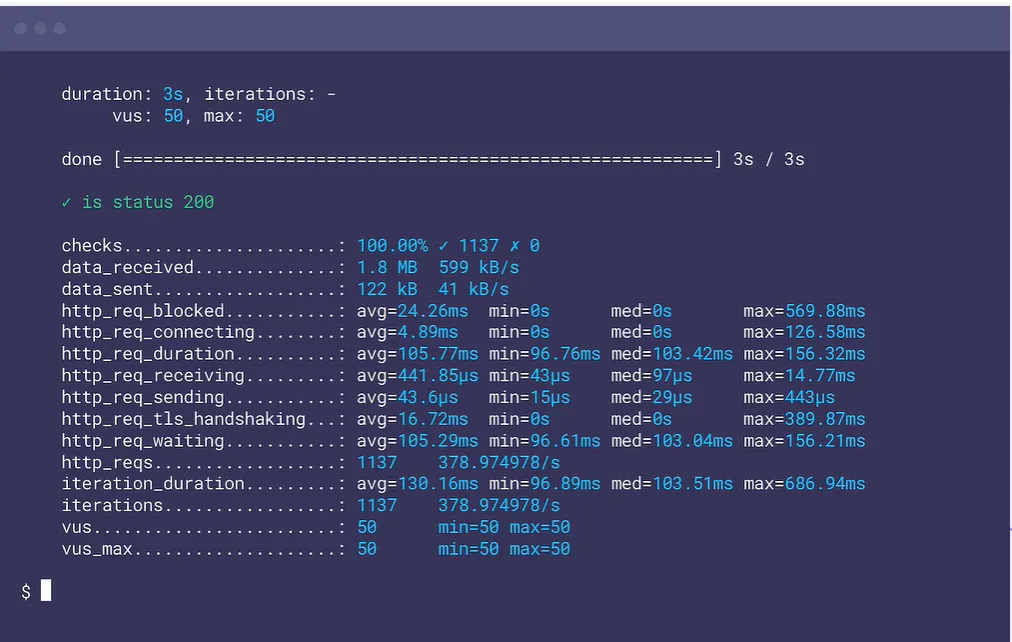
Understanding Test Results
k6 outputs the following key metrics to the terminal after test completion:
- checks: Number of passed/failed validations
- data_received: Total data received
- data_sent: Total data sent
- http_req_duration: HTTP request duration (avg, min, max, p90, p95)
- http_req_failed: Failed request rate
- iterations: Completed iteration count
- vus: Virtual user count
http_req_duration is the most important metric. While averages are sensitive to outliers, p95 represents the experience of the vast majority of users.
💻 Building Powerful Test Scenarios with JavaScript
k6's true power lies beyond simple HTTP requests—it's in simulating complex real-world user behaviors. With full access to JavaScript capabilities, you can write dynamic and intelligent tests.
1. Load Pattern Design with Stages
Real traffic isn't constant. You need to simulate various load patterns like launch events, marketing campaigns, and daily usage patterns:
export const options = {
  stages: [
    { duration: '2m', target: 100 },   // Ramp-up: Increase to 100 VUs over 2 minutes
    { duration: '5m', target: 100 },   // Steady state: Maintain 100 VUs for 5 minutes
    { duration: '2m', target: 400 },   // Spike: Jump to 400 VUs over 2 minutes
    { duration: '5m', target: 400 },   // Spike sustain: Maintain 400 VUs for 5 minutes
    { duration: '3m', target: 0 },     // Ramp-down: Gradually stop over 3 minutes
  ],
  thresholds: {
    http_req_duration: ['p(95)<500'],  // 95% of requests under 500ms
    http_req_failed: ['rate<0.1'],     // Failure rate under 0.1%
  },
};
2. Complex User Flows with Scenarios
Use scenarios to simulate multiple types of user behaviors simultaneously:
export const options = {
  scenarios: {
    // Scenario 1: Regular browsing users
    browsing: {
      executor: 'constant-vus',
      vus: 50,
      duration: '10m',
      exec: 'browseProducts',
    },
    // Scenario 2: Purchase conversion users (higher priority)
    purchasing: {
      executor: 'ramping-vus',
      startVUs: 0,
      stages: [
        { duration: '2m', target: 10 },
        { duration: '8m', target: 10 },
      ],
      exec: 'completePurchase',
      gracefulRampDown: '30s',
    },
    // Scenario 3: API clients (arrival-rate based)
    api_calls: {
      executor: 'constant-arrival-rate',
      rate: 1000,
      timeUnit: '1m', // 1000 requests per minute
      duration: '10m',
      preAllocatedVUs: 20,
      maxVUs: 100,
      exec: 'apiRequests',
    },
  },
};

export function browseProducts() {
  http.get('https://shop.example.com/products');
  sleep(Math.random() * 3 + 1); // Random wait 1-4 seconds
}

export function completePurchase() {
  const payload = JSON.stringify({ product: 'laptop', qty: 1 });
  http.post('https://shop.example.com/cart', payload, {
    headers: { 'Content-Type': 'application/json' },
  });
  sleep(2);
}

export function apiRequests() {
  http.get('https://api.example.com/v1/data');
}
3. Parameterization and Data Usage
Real tests require diverse input data. k6 can read CSV, JSON files, or use external data sources:
import { SharedArray } from 'k6/data';
import papaparse from 'https://jslib.k6.io/papaparse/5.1.1/index.js';

// Load CSV file
const csvData = new SharedArray('users', function () {
  return papaparse.parse(open('./users.csv'), { header: true }).data;
});

export default function () {
  const user = csvData[Math.floor(Math.random() * csvData.length)];

  const payload = JSON.stringify({
    username: user.username,
    password: user.password,
  });

  const response = http.post('https://api.example.com/login', payload, {
    headers: { 'Content-Type': 'application/json' },
  });

  check(response, {
    'login successful': (r) => r.status === 200 && r.json('token') !== '',
  });
}
4. Collecting Custom Metrics
Beyond default metrics, you can collect business-specific metrics:
import { Trend, Rate, Counter, Gauge } from 'k6/metrics';

// Custom metric definitions
const loginDuration = new Trend('login_duration');
const checkoutErrorRate = new Rate('checkout_errors');
const itemsAdded = new Counter('items_added_to_cart');
const activeUsers = new Gauge('concurrent_shoppers');

export default function () {
  const start = Date.now();

  const loginRes = http.post('https://shop.example.com/login', credentials);
  loginDuration.add(Date.now() - start);

  if (loginRes.status !== 200) {
    checkoutErrorRate.add(1);
  }

  // Add item to cart
  const cartRes = http.post('https://shop.example.com/cart/add', item);
  if (cartRes.status === 200) {
    itemsAdded.add(1);
  }

  activeUsers.add(1);
  sleep(5);
  activeUsers.add(-1);
}
🔌 The xk6 Extension Ecosystem: From Browser to gRPC
While k6's core is lightweight, fast HTTP testing, the xk6 extension system allows infinite feature expansion. Extensions are written in Go and integrated into k6 through custom builds.
Key xk6 Extension Modules
Chromium-based browser automation for measuring Core Web Vitals. Simulates real user actions like page loads, clicks, and form inputs.
import { browser } from 'k6/experimental/browser';

export const options = {
  scenarios: {
    ui: {
      executor: 'shared-iterations',
      options: {
        browser: {
          type: 'chromium',
        },
      },
    },
  },
};

export default async function () {
  const page = browser.newPage();

  try {
    await page.goto('https://shop.example.com');

    // Search for product
    await page.locator('input[name="search"]').type('laptop');
    await page.locator('button[type="submit"]').click();

    // Collect performance metrics
    const metrics = await page.evaluate(() => {
      return JSON.stringify(performance.getEntriesByType('navigation'));
    });

    console.log(metrics);
  } finally {
    await page.close();
  }
}Test gRPC protocols in microservices environments. Supports Protocol Buffers.
import grpc from 'k6/net/grpc';
import { check } from 'k6';

const client = new grpc.Client();
client.load(['definitions'], 'service.proto');

export default () => {
  client.connect('grpc.example.com:443', {
    plaintext: false,
  });

  const response = client.invoke('service.Method', {
    key: 'value',
  });

  check(response, {
    'status is OK': (r) => r && r.status === grpc.StatusOK,
  });

  client.close();
};Execute queries directly on various databases including MySQL, PostgreSQL, SQLite, and SQL Server.
Generate realistic fake data (names, addresses, emails, etc.) for more realistic testing scenarios.
Installing and Using Extensions
Use the xk6 build tool to create custom k6 binaries:
# Install xk6
go install go.k6.io/xk6/cmd/xk6@latest

# Build k6 with browser extension
xk6 build --with github.com/grafana/xk6-browser

# Include multiple extensions
xk6 build \
  --with github.com/grafana/xk6-browser \
  --with github.com/grafana/xk6-sql \
--with github.com/grafana/xk6-faker🔄 CI/CD Integration: Embedding Performance Tests in DevOps
In modern software development, performance testing should be performed continuously from the early stages of development, not just before production deployment. k6 fully supports this "Shift-Left" philosophy.
GitHub Actions Integration
Example of running smoke tests automatically on every Pull Request:
# .github/workflows/performance.yml
name: Performance Tests

on:
  pull_request:
    branches: [main, develop]
  push:
    branches: [main]

jobs:
  smoke-test:
    runs-on: ubuntu-latest
    steps:
      - uses: actions/checkout@v4

      - name: Setup k6
        uses: grafana/setup-k6-action@v1

      - name: Run smoke tests
        uses: grafana/run-k6-action@v1
        with:
          path: ./tests/smoke.js
          flags: --env ENV=staging
        env:
          K6_CLOUD_TOKEN: ${{ secrets.K6_CLOUD_TOKEN }}

      - name: Upload results
        if: always()
        uses: actions/upload-artifact@v4
        with:
          name: k6-report
          path: ./summary.html
GitLab CI Integration
# .gitlab-ci.yml
performance_test:
  image: grafana/k6:latest
  stage: test
  script:
    - k6 run --out json=results.json tests/load.js
  artifacts:
    paths:
      - results.json
    expire_in: 1 week
  only:
    - merge_requests
    - main
Jenkins Pipeline
// Jenkinsfile
pipeline {
    agent any

    environment {
        K6_TOKEN = credentials('k6-cloud-token')
    }

    stages {
        stage('Performance Test') {
            steps {
                sh '''
                    docker run --rm -v $(pwd):/tests \
                      -e K6_CLOUD_TOKEN=$K6_TOKEN \
                      grafana/k6:latest cloud /tests/load.js
                '''
            }
        }
    }

    post {
        always {
            publishHTML([
                allowMissing: false,
                alwaysLinkToLastBuild: true,
                keepAll: true,
                reportDir: 'results',
                reportFiles: 'index.html',
                reportName: 'k6 Performance Report'
            ])
        }
    }
}
Preventing Performance Regression: Threshold-Based Gates
The most important aspect of CI/CD is setting clear performance criteria. k6's thresholds can automatically block deployments:
export const options = {
  thresholds: {
    // HTTP request criteria
    http_req_duration: ['p(95)<500', 'p(99)<1000'],
    http_req_failed: ['rate<0.05'],

    // Business logic criteria
    checks: ['rate>=0.95'],

    // Custom metric criteria
    login_duration: ['avg<300', 'p(95)<600'],
    checkout_errors: ['rate<0.01'],
  },

  // Stop test on threshold failure
  abortOnFail: true,
};abortOnFail: true option immediately stops the test when thresholds fail. Recommended for protecting production environments, but start with false when setting initial baselines.
☁️ Grafana Cloud k6: Cloud-Based Distributed Testing
To run tests simultaneously from 21 load zones worldwide, beyond the limitations of your local machine, use Grafana Cloud k6. Many new features have been added as of 2025.
Key Features
Global Load Zones
Run tests simultaneously from 21 regions across the US, Europe, Asia, and South America. Measure real global user experiences.
Real-time Results Analysis
View metrics in real-time during test execution and stop immediately if issues arise.
GitHub Actions Integration
Automatically add test summaries as comments on Pull Requests so team members can immediately see performance changes.
Extension Module Support
Use xk6 extensions in the cloud, enabling complex protocol testing as well.
Running Cloud Tests
Run cloud tests directly from the CLI:
# Login
k6 cloud login --token YOUR_TOKEN

# Run test in cloud
k6 cloud script.js

# Run in specific load zones
k6 cloud --ext-load-impact distribution='{"amazon:us:ashburn": 0.5, "amazon:de:frankfurt": 0.5}' script.js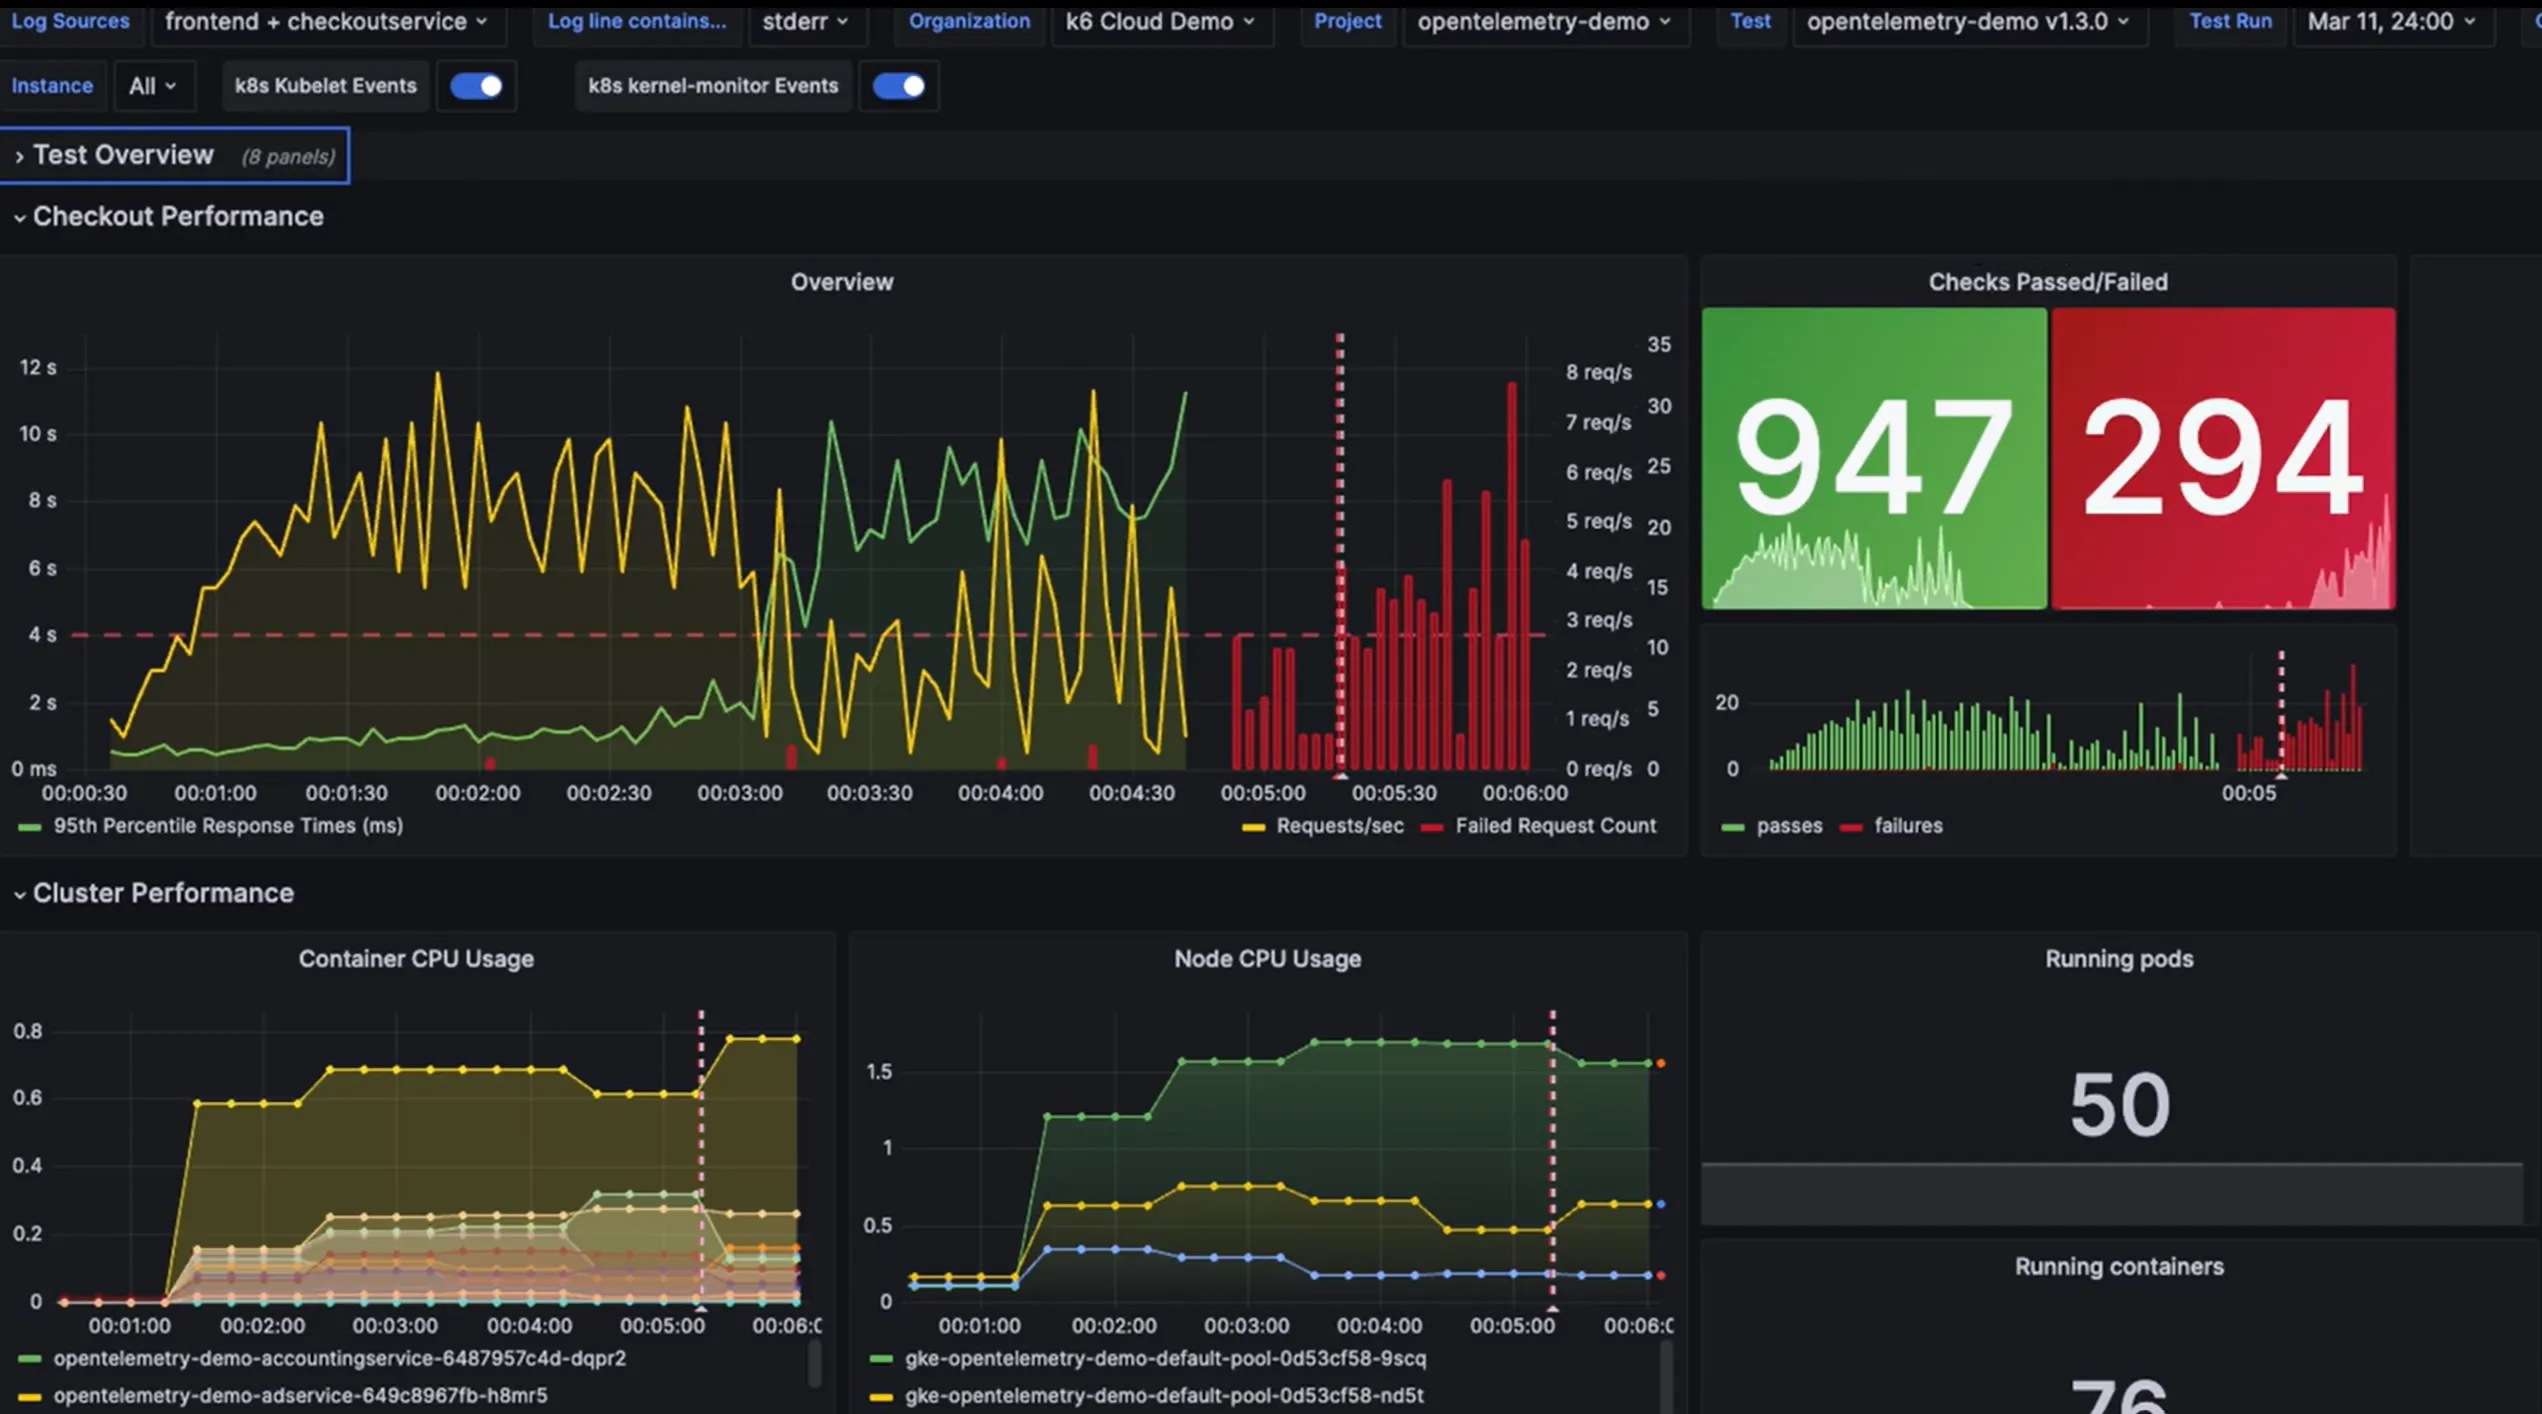
Pricing (As of 2026)
| Plan | Virtual Users (VU) | Test Execution Time | Key Features |
|---|---|---|---|
| Free | Up to 50 VU | 500 VUh/month | Basic metrics, 30-day data retention |
| Pro | Up to 5,000 VU | Flexible credits | Extensions, 1-year data retention, SLA |
| Enterprise | Unlimited | Custom | On-premise option, dedicated support, SSO |
💡 Pro Tips and Community Insights
Tips gathered from developers using k6 in real production environments.
1. Preventing Memory Leaks
Due to JavaScript's nature, accumulating large amounts of data in global variables can cause memory usage to spike:
// ❌ Bad example: Memory leak occurs
const allResponses = [];

export default function () {
  const res = http.get('https://api.example.com/data');
  allResponses.push(res); // Memory keeps increasing per VU
}

// ✅ Good example: Extract only needed data
export default function () {
  const res = http.get('https://api.example.com/data');

  // Extract only necessary values and validate immediately
  check(res, {
    'has valid data': (r) => r.json('status') === 'ok',
  });

  // Record only in global metrics
  myMetric.add(res.timings.duration);
}
2. DNS Caching Optimization
DNS lookups can become a bottleneck in high-load tests:
export const options = {
  // Enable DNS caching
  dns: {
    ttl: '5m', // Cache for 5 minutes
    select: 'first', // Use only first IP
    policy: 'preferIPv4',
  },
};
3. Minimizing TLS Handshakes
Reduce TLS overhead through connection reuse:
export const options = {
  // Connection keep-alive settings
  batch: 20, // Batch requests
  batchPerHost: 6, // Max concurrent connections per host
  noConnectionReuse: false, // Enable connection reuse
  tlsAuth: null, // Disable TLS mutual auth (if not needed)
};
4. Common Pitfalls from the Community
Missing sleep() Function
Without sleep between requests, unrealistic load occurs. Real users need time to think and click after page loads.
Hardcoding Environment Variables
Don't write URLs and credentials directly in code. Use the __ENV object to inject them from outside.
Repeated JSON Parsing
Parsing the same JSON response multiple times increases CPU usage. Store parsed results in variables.
SharedArray Misuse
Loading large CSV files into SharedArray causes all VUs to share memory, potentially causing OOM. Shard your data instead.
5. Debugging Tips
# Verbose logging
k6 run --verbose script.js

# HTTP debugging
k6 run --http-debug="full" script.js

# Run only specific VU (for debugging)
k6 run --vus 1 --iterations 1 script.js

# Export results as JSON
k6 run --out json=results.json script.js
🔮 2026 Outlook and Conclusion
With the k6 1.0 release in May 2025, k6 reaffirmed its vision of "reliable, predictable, and scalable performance testing." Under Grafana Labs' support, it's evolving in the following directions:
Roadmap and Future Features
- AI-Based Performance Analysis: Automatically detect anomalies in test results and suggest causes
- Enhanced Browser Testing: Full Web Vitals support and visual regression test integration
- Chaos Engineering: k6 and LitmusChaos integration for failure injection testing
- WebSocket Improvements: Support for more complex real-time scenarios
Key Takeaways
k6 is a load testing tool optimized for modern development workflows. Combining the familiarity of JavaScript, the performance of Go, and the visualization of Grafana, it's an excellent choice for microservices and cloud-native application testing. If you don't need JMeter's extensive protocol support, consider switching to k6.
Get Started: brew install k6 or docker pull grafana/k6 and start right now!
🚀 Performance testing should give confidence, not fear. With k6, deploy to production with peace of mind.